Case study

AI dashboard to reduce production time and product waste by 1/3rd

33%
faster production
Real time
manufacturing monitoring
£250m
size of portfolio affected

The upshot

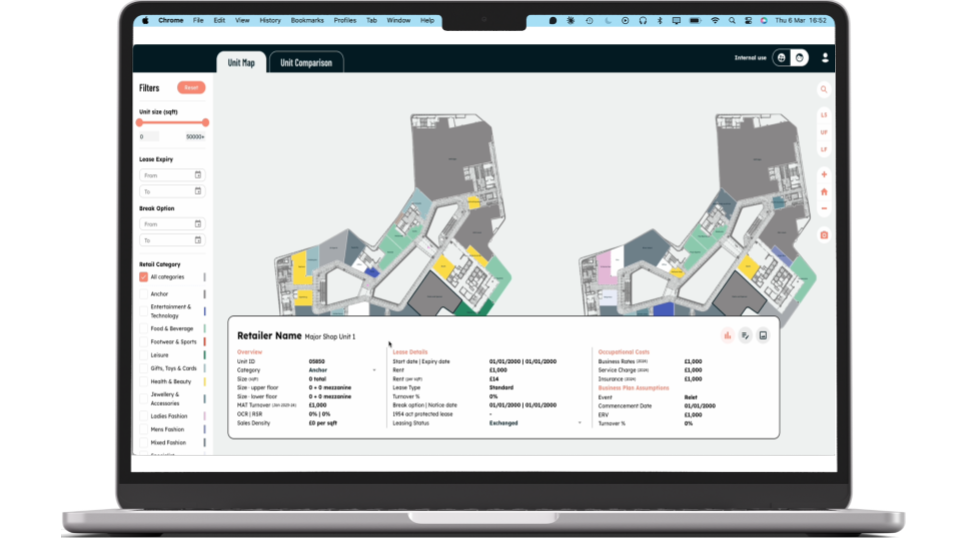
Production monitoring for millions of units

Our client is a leading consumer healthcare organisation with manufacturing plants worldwide producing thousands of household name products. Some of their largest toothpaste brands have a more complex formulation, resulting in 3 times higher production time and increased quality issues for a quarter of their billion pound turnover toothpaste portfolio.

Datasparq developed a real-time manufacturing monitoring dashboard that empowers workers to monitor and correct toothpaste manufacturing in real-time. Using newly installed equipment sensors, the solution tracks key metrics such as temperature, pressure and speed throughout the manufacturing process.

The dashboard is now live across the 2 largest manufacturing plants and is being scaled to new product lines.

Key benefits:

  • Real-time visibility into manufacturing progress across up to 12 simultaneous batches
  • First real-time data science product built from scratch in client environment
  • Actionable insights available for immediate implementation by site operatives
Designing a real-time monitoring dashboard
Manufacturing plant

The opportunity

Complex manufacturing inefficiencies

Our client needed to decrease production time by a third to free up capacity and enable higher returns on existing assets, while improving batch quality to reduce throw-away waste and customer complaints.

Limited detailed batch data was available to site operatives, who undertook manual batch inspections with limited visibility across Production, Quality, Continuous Improvement and R&D teams. With up to 12 batches in progress at any time and over 30 steps in each batch's production, the complexity was overwhelming existing manual processes.

The challenges we faced:

  • Complex formulations causing 3x higher production times for premium brands
  • Limited real-time visibility into manufacturing parameters across multiple batches
  • Manual inspection processes with poor cross-team visibility
A typical sprint plan
The solution

Real-time manufacturing dashboard

We developed a real-time dashboard using newly installed equipment sensors, combining Datasparq's product and data engineering expertise with our client's data science team and domain knowledge.

01
User-focused design

We put wireframes and early versions in the hands of users throughout design and development, ensuring the solution met real operational needs rather than theoretical requirements. This collaborative approach was essential given there are no off-the-shelf products able to deliver the intelligence and capability required.

02
Intelligent step-detection capability

The dashboard is powered by algorithms that analyse sensor inputs to determine which step in the 30-step process each product is at. While the sensors detect key parameters like speed, temperature and pressure, they cannot detect the specific production step—yet each stage has different tolerances crucial to successful manufacturing.

03
Real-time monitoring

The dashboard monitors parameters at each stage with data updated every 60 seconds. Users can see live and historical data from equipment across all sites, interrogate specific batches to identify progress, and receive alerts when there's risk of exceeding parameters so they can take immediate corrective action.

1. Proof of concept

First testing with a supermarket depot demonstrated capabilities beyond established industry tools, impressing transport leadership with performance that surpassed existing SaaS solutions.

2. First deployment

Applied to a major retailer's largest and most complex depot, exploring delivery types and time window flexing. This phase delivered substantial annual savings that continue to benefit operations today.

3. Extended capabilities

Extended to a more challenging network with multiple depots, handling unionised workforces, two-person deliveries and a wider variety of vehicle types. This phase demonstrated the optimiser's adaptability to different operational constraints.

4. Enterprise-ready

Standardised data formats and pipelines to create a system applicable across diverse customer networks, with further optimisation for a home improvement retailer adding wait time and compactification features that doubled performance.

Interactive example

Try it for yourself

Explore how the science works in this PlayML data science notebook

How we deliver projects

The impact

A first-of-its-kind data product

This data product sits at the core of our client's manufacturing strategy, enabling staff to maintain operational improvements while identifying problem steps for continuous improvement.

The Production team can take mitigating actions when batches deviate from standards. The Quality team has assurance that batches meet required standards. The R&D team can identify problem steps for targeting improvements. The Continuous Improvement team can define improvement plans and track their success.

Site operatives' experience has been transformed, with actionable insights now available for immediate implementation.

Key impacts:

  • Transformed site operative experience with real-time actionable insights
  • Cross-functional visibility enabling coordinated improvements
  • Foundation for predictive manufacturing management in future phases

Call us when you're ready